What Kind Of Stats We Collect

Climate Change Stats

Climate change is a reality, no matter how many prominent figures insist on hiding their heads in the sand. This reality becomes clearer and more terrifying when seen in terms of hard and fast factual stats. In 2016, the earth's surface temperature was measured at around 0.94 Celsius degrees warmer than the average of the 20th century. The 21st century has thus broken historical temperature records, according to NASA and the NOAA.

More Climate Change Stats
Health stats

Health stats

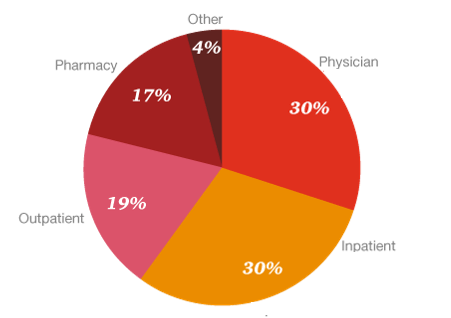
In the United Kingdom, the total expenditure on healthcare was ?125 billion in 2017/18, which is expected to rise over ?127 billion in 2017/18. Of the GDP, the UK spent 9.8% on health in 2014, according to data from the Organization for Economic Co-operation and Development (OECD). This is higher than the median for OECD member states but second lowest of the seven nations included in the G7, a situation that had remained constant since 2013, when United Kingdom health accounts were introduced. This is about the average expenditure of the other EU-15 countries, which spend about 9.7% on health.

More Health Stats
Social Media and Marketing Stats

Social Media and Marketing

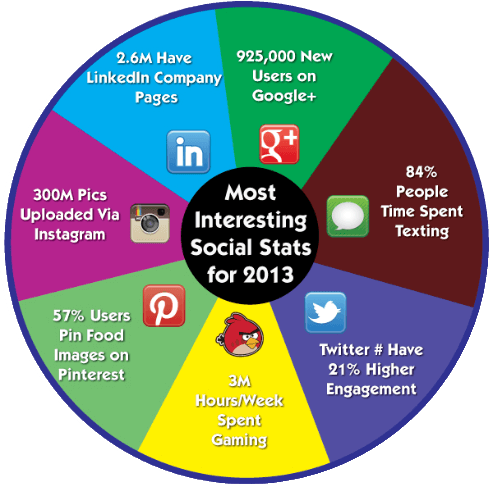
More than 42% of the global population of internet users are also social media users, which is around 3.196 billion people. Considering only Facebook, it is clear at what a quick pace this number must be growing. The company is reaching 2.2 billion monthly active users. Other social networking apps and sites are also at their all-time high in terms of users right now. In the United States, 7 out of 10 people are the owners of at least one social media account.

More Digital Marketing Stats
Sport Betting stats

Sport Betting stats

Gambling is and has always been an addictive sport for humankind. From times immemorial, great men and small, all have had a weakness for captivating games of luck that conjure or vanish money before their very eyes.

According to the gambling rates study, around 1.6 billion adventurous people gamble during any given year, with 4.2 billion having gambled at one time or another. Amongst the countries where gambling is most popular, be it of any kind-lotteries, sports betting or even horse racing- Great Britain takes first place, with the highest percentage of worldwide players under the age of 21. The total population of gamblers in the country is around 65%. Australians aren't far behind in this regard, with gambling losses per adult resident being around $990 in 2016, which is the highest in the world. China and Macau, though under a ban on land-based and online casinos, produce a significant gambling income of more than 50 billion dollars and expanding through state lotteries, sports betting and Mahjong.

More Betting Stats
About me - Jonathan Turner

But who is The man behind getstats.org.uk?

My name is Jonathan Turner. I am 22 years old, born and brought up in Devonshire, United Kingdom. Currently, I am a student at Imperial College London where I am desperately endeavouring, through exotic dark magic, to complete my PhD in Statistics. I cannot say correctly as to when I, or my parents, realized my love for numbers and applications on society. I am always told stories of how I would sit glued to the television, or keep reading books, about facts and stats that I would then recite randomly to anyone who would listen. I have always had a good memory and a certain way with numbers that fascinated my primary school teachers to no extent.

More about me

Understanding Statistics - Basic Glossary

When large numbers need to be analysed, be it in an industrial, laboratory or social problem, this is where statistics come into play. Statistics is a branch of mathematics that deals with the collection of data and its subsequent organization, analysis, interpretation, and presentation. Studying statistical charts and graphs can sometimes be a little confusing, mostly due to the used terminology. For that purpose, here is a glossary of some of the most common words and phrases that one might encounter:

  1. Population - In statistics, a population is a set of comparable items or affairs that are under speculation concerning a particular question or experiment. A statistical population includes all members of a defined group that is under observation, is being studied, and about which information is being collected. For example, if the political affiliations of the English capital are to be studied, then all the residents of London would be taken as the Statistical Population.
  2. Sample - The sample is a part of the population. Typically, a statistical population is too large to make conducting studies on it practical, so instead, a smaller group is selected from the greater population, and this smaller group is brought under the microscope. A representative sample is such a sample that has characteristics linearly similar to the total population. Statistics experts strive for just such a sample.
  3. Statistic - A statistic is an attribute of a population. It is generally used to estimate a population parameter. For example, if a sample of 100 people is selected from an initial population of 10,000, then their average height would be an example of a statistic. Descriptive statistics is a single result obtained on analysing a set of data, whereas Statistical inference is the conclusion drawn about the population using the data obtained and the following descriptive statistics.
  4. Parameter - The parameter in statistics is any quality that characterizes and typifies the population under scrutiny or some specific aspect of it. It is a fixed statistical measure that is used as the value of a variable in a general distribution or frequency function which makes it descriptive of the population.
  5. Variable - A variable is any quality, characteristic or number that can be measured or counted in some way. Age, year of birth, country of birth, eye colour, test scores, income and expenses, etc. are some examples of variables. There are different types of variables. Some most common ones are:
    • Numerical variables are variables whose values are numbers.
    • Categorical variables are variables that can be put into categories. For example, 'hair colour', 'car type', etc.
    • Continuous variables are variables that can have an infinite number of values. For example, 'time', 'weight', etc.
  6. Data - Data are single pieces of verifiable information recorded that can then be used for the purpose of population analysis. Data is the raw information needed to carry out statistical operations-interpretation and presentation.
Our Glossary Continues Below
Events on statistics and data analysis

Events on statistics and data analysis

In this article you wiil learn about upcoming events concerning statistics in the UK. Make sure you attend and participate in at least a few if you happen to be close-by.

Learn more
A Brief History of Statistics

A Brief History of Statistics

Everything in this world has a history, even numbers and how we use them. Statistics in the UK has a long history that can be dated back to 1941 when the Central Statistical Office was established to improve the consistency of statistical data.

Learn more

  1. Datum - 'Datum' is singular of 'Data'. Whereas several bits of information can collectively be called data, a single constituting piece is called a datum. The word is taken from the Latin for 'something given'.
  2. Mean - The statistical mean is the average or mean of the gathered information, which is used to acquire the central tendency of the data relative to the population in question. The statistical mean can be obtained by adding all the data points and then dividing them by the number of points.
  3. Weighted arithmetic mean - Weighted arithmetic mean is very similar to ordinary mean, different in only that where every data point contributes equally to the final result in ordinary mean, in weighted arithmetic mean some data points contribute more than others. Weighted arithmetic mean is relevant in descriptive statistics.
  4. Median - The statistical median is a simple measure of central tendency. To find the median, the data is arranged in the order of smallest to largest. If there are an odd number of observations, then the middle entry is taken as the median value. If there are an even number of observations, then the average of the two middle values is taken as a median.
  5. Proportion - Proportion refers to a part of the population that possesses a certain attribute, expressed as a fraction, decimal or percentage of the whole population. For a finite population set, the proportion is the number of members with a certain attribute divided by the total number of members. For example, if we considered three plants-a rose bush, an apple tree, and a grapevine-then the proportion of trees is 1/3 or 0.33.
  6. Percentile - A percentile in statistics indicates the value below which a given percentage of observations fall. For example, if your test score falls in the 90th percentile, it means that you scored better than 90% of the people who took the test with you.
  7. Variance - Statistically, the variance is the measure of how far any particular member is from the mean of a set. To find out the variance or deviation from the mean, subtract the mean from all the values of the set.